Debugging an embedded Linux system - part III
When your program is living its regular life, you have functions calling functions until the program exits in one way or the other. Even when talking about daemons, nothing lasts forever.
When a bug occurs, the most natural way of finding the root cause is to look at two things:
- The location where the program crashed
- The chain of function calls that lead to that location
The latter is most commonly called a backtrace or a stack trace. One end of the backtrace being the origin of the crash.
Among the many missions of the debugger, a crucial one is to give you such a backtrace, together with some tooling to inspect the program state: register values, memory content and so on.
As discussed in part I, even if coredumps are a way to get backtraces for programs that crashed, they suffer from some limitations. Coredumps can be huge files, containing some secrets, because they are a dump of the process memory after-all. For those reasons, they are not always the best candidates to get backtraces on the field.
Let say that part of your embedded code-base is written in Python. There, you will have such backtraces for free when a bug occurs:
mathieu@meije ~$ python3 tmp/bt.py
Caught an exception:
Traceback (most recent call last):
  File "/home/mathieu/tmp/bt.py", line 14, in main
    level1()
  File "/home/mathieu/tmp/bt.py", line 10, in level1
    level2()
  File "/home/mathieu/tmp/bt.py", line 7, in level2
    level3()
  File "/home/mathieu/tmp/bt.py", line 4, in level3
    raise RuntimeError("Something went wrong at level 3!")
RuntimeError: Something went wrong at level 3!
Now, what about your C and C++ programs? Well, with some effort and the use of libunwind, you can get something quite similar:
mathieu@meije ~ [env]$ ./a.out
Backtrace (oldest to newest):
  0x401478: main+0xe
main at /home/mathieu/tmp/bt.c:68
  0x401467: level1+0xe
level1 at /home/mathieu/tmp/bt.c:64
  0x401456: level2+0xe
level2 at /home/mathieu/tmp/bt.c:60
  0x40143e: level3+0xe
level3 at /home/mathieu/tmp/bt.c:55
That’s the whole point of this article.
The concepts behind backtraces
Backtrace support is not directly part of GCC. Sadly we cannot pass an
--enable-backtrace option at compilation and get backtraces out of the
box. Worse than that, there are many things to take into consideration on that
topic, and no go-to resources on the Internet.
The lack of information stems from the fact that backtraces are dependant of you hardware architecture, your operating system, your distribution, your compiler, the way you compile, and the tooling that you use to produce a backtrace.
All of that put together, means that probably only big companies are making the effort of having backtrace support for their C and C++ programs on the field. The rest of us only rely on what’s widespread and available: coredumps and a debugger such as GDB.
To be able to get backtraces for my specific use-case, a C++ firmware on an embedded Linux device, I had to dive deeply into that topic. Let me introduce you to some key concepts so that you can maybe spare some time in the process.
Stack trace
As mentioned above stack trace would be a better term for backtrace. To
get the call chain, the only option that we have is to unwind the stack, in
order to get a trace, hence a stack trace.
In the above C example backtrace, the main function is calling the level1
function that is calling the level2 function that is in turn calling the
level3 function that is producing the backtrace.
It means that at the moment we are producing the backtrace, the stack look like that:

The SP (stack pointer) register is pointing to the bottom of the stack. Up
in the stack, we have the different return addresses in yellow. When creating
the backtrace, we already know that we are in the level3 function because
the PC (program counter) register contains a value somewhere in the level3
function. Then, if we can get the first yellow box value, which is an address
within the level2 function then we will know that level2 called us. If we
repeat that operation again, we will finally know that the level1 function
called us.
At that stage we will be able to print a backtrace that is exhibiting the
whole call chain. Problem is, from the SP value, how do we know what is the
size of the blue box (level3 local variables)? The size of that box will
depend on what the level3 function is doing, and which exact instruction of
the level3 function is executed.
The compiler knows all that stuff, but at runtime this information is lost. Without additional data from the compiler, we cannot know the blue box sizes. Without the blue box sizes, we cannot know the return address values, and we cannot print a backtrace.
Fortunately, the compiler can append such unwinding data to the binary. More than that, it will almost always add such data to the binaries because they are used for exception handling in C++. That’s not the topic of this article, but just note that C++ exception handling also relies on stack unwinding and then also needs unwinding material.
Unwinding material
Now, what this unwinding material looks like? Well, it depends on the architecture. Two of the most common formats are:
- ARM Exception Index tables
Those are used specifically on 32 bits ARM CPUs and C++ exception handling relies on them. We can see them in the binaries this way:
mathieu@meije ~$ arm-linux-gnueabi-readelf -S armv7.bin
...
  [16] .ARM.extab
  [17] .ARM.exidx
...
- DWARF Call Frame Information tables (CFI)
Those are used on x86_64, AArch64, MIPS, RISC-V, and many more architectures. They are part of the DWARF debugging standard.
C++ exception handling relies on that format, and uses the .eh_frame and
.eh_frame_hdr sections:
mathieu@meije ~$ readelf -S x86_64.bin
...
  [17] .eh_frame_hdr
  [18] .eh_frame
...
To make things a bit more complex, on those architectures, and sometimes on
ARMv7, you may find a .debug_frame section.
mathieu@meije ~$ readelf -S x86_64.bin
  [31] .debug_frame
The .debug_frame section also contains DWARF unwinding material but is more
meant for debuggers. The .eh_frame section contains an extended LEB128-based
format which slightly differs from the DWARF standard, while the
.debug_frame section strictly follows the DWARF standard.
The .eh_frame section will always be part of the binary and will be loaded
into memory, while the .debug_frame section will often be stripped and live
in separate .debug files.
The first part of getting a backtrace is then to make sure that you have unwinding material. Because that mechanism is used for C++ exception handling, it is very likely that you will have such sections in your binaries.
However, if you are targeting an ARMv7 CPU, then it is important to note that the unwinding format will be different, and that your unwinding library needs to take that into account.
You may then ask, what are in those sections? Well, without giving too much details, those ELF sections contain directives that will allow you, from any point in your program, to find the location of the next return address. In more simple terms, the size of the blue box, at any point.
You can display part of those instructions, in the context of the .eh_frame
section on x86_64, that way:
mathieu@meije ~$ objdump  --dwarf=frames x86_64.bin
...
00000090 0000000000000024 00000000 FDE cie=00000000 pc=0000000000401459..000000000040146a
  DW_CFA_advance_loc: 1 to 000000000040145a
  DW_CFA_def_cfa_offset: 16
  DW_CFA_offset: r6 (rbp) at cfa-16
  DW_CFA_advance_loc: 3 to 000000000040145d
  DW_CFA_def_cfa_register: r6 (rbp)
  DW_CFA_advance_loc: 12 to 0000000000401469
  DW_CFA_def_cfa: r7 (rsp) ofs 8
  DW_CFA_nop
  DW_CFA_nop
  DW_CFA_nop
  DW_CFA_nop

000000b8 0000000000000024 00000000 FDE cie=00000000 pc=000000000040146a..000000000040147f
  DW_CFA_advance_loc: 1 to 000000000040146b
  DW_CFA_def_cfa_offset: 16
  DW_CFA_offset: r6 (rbp) at cfa-16
  DW_CFA_advance_loc: 3 to 000000000040146e
  DW_CFA_def_cfa_register: r6 (rbp)
  DW_CFA_advance_loc: 16 to 000000000040147e
  DW_CFA_def_cfa: r7 (rsp) ofs 8
  DW_CFA_nop
  DW_CFA_nop
  DW_CFA_nop
  DW_CFA_nop
In a nutshell, the program is segmented into different parts: 0x401459
.. 0x40146a for the first block in the objdump output above, and 0x40146a
.. 0x40147f for the second block. Then, pseudo virtual machine instructions
such as DW_CFA_advance_loc and DW_CFA_offset, allow you to restore some of
the registers at that point in time. The CFA which stands for canonical
frame address, points to the top of the call frame, so right before the return
address. By running the pseudo virtual machine instructions in the block that
matches your current location in the program, you can get the CFA value, and
then by reading the stack value at that location, the precious return address.
In addition to the unwinding tables, there is another way to walk back the stack: frame pointers.
A frame pointer is a CPU register that points to a fixed location within a
function’s stack frame. On ARMv7, the register typically used for this is
r7. When frame pointers are used, each function saves the previous frame
pointer on the stack, creating a linked list of stack frames.

To create the backtrace, things are then more simple than with the previous unwind table based approach. A basic algorithm such as:
- Read current frame pointer in
r7 - Read saved frame pointer from
[r7], which is the previous frame pointerfp - Read return address from
[fp + 4] - Repeat
would do the trick on ARMv7. The compiler may omit those frame pointers
because, it can then use r7 for other purposes. It also saves some
instructions not to push the frame pointer to the stack at every function
start. When using GCC you can pass the -fno-omit-frame-pointer option to
force the use of frame pointers and prevent any omission.
Yet, the rest of the article focuses on the use of DWARF unwinding tables instead of frame pointers. The DWARF unwinding tables are possibly more portable as they do not imply a special hardware register, together with some function prologue that the compiler may or may not issue.
Symbols
At that stage, either by using unwind tables or frame pointers, we can walk back the stack and produce a backtrace. It will just consist of raw addresses though:
Backtrace (oldest to newest):
  0x401101
  0x401478
  0x401467
  0x401456
  0x40143e
That’s not so bad after all. We can open the disassembly of the program, and manually create the backtrace. It is OK to do that once in a while, but you will loose your mind in the long run. The next step is then, to manage to have some symbols: the name of the functions that are matching the addresses above. Something like that:
Backtrace (oldest to newest):
  0x401101: _start+0x21
  0x401478: main+0xe
  0x401467: level1+0xe
  0x401456: level2+0xe
  0x40143e: level3+0xe
If storage space is not issue, then you can produce some binaries with the GCC
option -g and not strip them. They will contain the required symbols, and
backtrace producers such as
libunwind can take advantage of
that.
If on the other hand you are using Yocto that strips everything by default, then you won’t have access to any symbols on the target. You can work around that in two different ways:
-
By post-processing the backtraces with addresses on your host. If you have saved the separate debug files as explained in part I, you can use them to produce a complete backtrace with symbols on host.
-
By using the minidebuginfo mechanism, again as explained in part I. This one will instruct Yocto to keep compressed, minimal debug symbols. It will only add a ~10% overhead to the image. Libunwind can automatically locate those compressed symbols in the binary, uncompress them and perform the addresses to symbols translation.
As a 10% overhead will often be acceptable, I would advise to go for the second option and add the following to your Yocto configuration:
DISTRO_FEATURES:append = "minidebuginfo"
That way, you can stop caring about symbols and focus on other aspects.
Backtracing library
Now, we have unwinding material, symbols and an overall understanding of how to create a backtrace. At that stage you can then go the hard-route and implement a custom backtracer. If you choose to rely on frame pointers it will not be so hard after all.
Otherwise, I think that even if there is little to no competition, libunwind is the best library out there to do the job.
It supports many architectures, with DWARF based, frame pointer based and even ARM Exception Index Tables based unwinding.
Let’s have a look to the program that is behind the C backtraces that are displayed above in the article:
#include <stdio.h>
#include <stdlib.h>
#include <unistd.h>
#include <libunwind.h>

#define MAX_FRAMES 64

struct frame {
    unw_word_t pc;
    char func_name[256];
    unw_word_t offset;
};

void print_backtrace() {
    unw_cursor_t cursor;
    unw_context_t context;
    struct frame frames[MAX_FRAMES];
    int count = 0;

    unw_getcontext(&context);
    unw_init_local(&cursor, &context);

    while (unw_step(&cursor) > 0 && count < MAX_FRAMES) {
        unw_get_reg(&cursor, UNW_REG_IP, &frames[count].pc);
        if (unw_get_proc_name(&cursor, frames[count].func_name,
                              sizeof(frames[count].func_name),
                              &frames[count].offset) != 0) {
            snprintf(frames[count].func_name, sizeof(frames[count].func_name), "unknown");
            frames[count].offset = 0;
        }
        count++;
    }

    printf("Backtrace (oldest to newest):\n");

    for (int i = count - 1; i >= 0; i--) {
        printf("  0x%lx: %s+0x%lx\n",
               (long)frames[i].pc,
               frames[i].func_name,
               (long)frames[i].offset);

        /* Use addr2line to resolve file:line. */
        char cmd[512];
        snprintf(cmd, sizeof(cmd),
                 "addr2line -e /proc/%d/exe -f -p 0x%lx",
                 getpid(), (long)frames[i].pc);
        system(cmd);
    }
}

void level3() {
    print_backtrace();
    exit(1);
}

void level2() {
    level3();
}

void level1() {
    level2();
}

int main() {
    level1();
    return 0;
}
As you see we are producing the backtrace in the print_backtrace
function. That one is called from the level3 function. While it serves as a
demonstration of how to produce a backtrace, it is not really useful in the
real life, because we do not know beforehand the bug locations. We would all
be jobless otherwise.
The idea is then to attach to different signal handlers, in particular
SIGSEGV and produce a backtrace there. You can have a look to that test
case of
the libunwind library for an example.
If you have different programs and libraries that you would like to be covered by libunwind, then a possibility is to create a generic library that is setting up the signal handlers. That library would then be used across your whole code-base. For my personal use-case, I have used a generic C++ library that takes care of installing the handlers:
   std::signal(SIGSEGV, detail::segmentation_fault_handler);
   std::signal(SIGABRT, detail::abort_handler);
   std::set_terminate(detail::termination_exception_handler);
Those handlers are calling the print_backtrace function, and re-raising the
signal so that, the coredump mechanism is also possibly triggered by the Linux
kernel.
static void segmentation_fault_handler(int signal)
{
   if (signal != SIGSEGV)
     return;

   print_backtrace();
   std::signal(SIGSEGV, SIG_DFL);
   std::raise(SIGSEGV);
}
The std::set_terminate function registers a handler so that in case of an
unhandled C++ exception, a backtrace is displayed allowing to locate the place
where the exception was thrown.
Offline translation
In the complete C libunwind example above, I am using addr2line directly to
get source file names and line numbers. That is because I am assuming that the
binary is not stripped and contains the required data for addr2line.
Meaning that the backtrace looks like:
Backtrace (oldest to newest):
  0x401478: main+0xe
main at /home/mathieu/tmp/bt.c:68
  0x401467: level1+0xe
level1 at /home/mathieu/tmp/bt.c:64
  0x401456: level2+0xe
level2 at /home/mathieu/tmp/bt.c:60
  0x40143e: level3+0xe
level3 at /home/mathieu/tmp/bt.c:55
instead of looking like that:
Backtrace (oldest to newest):
  0x401101: _start+0x21
  0x401478: main+0xe
  0x401467: level1+0xe
  0x401456: level2+0xe
  0x40143e: level3+0xe
Again, when using Yocto with stripped binaries, the file names and line numbers will be gone. Even when using minidebuginfo for symbols, the file names and line numbers are too heavy and won’t be part of the binary.
In that case, I think that the best trade off, is to display on target the backtrace with the addresses, the function names thanks to minidebuginfo and the offset from the function start. Then, write a script that takes such backtrace as an input, together with the separate debug info files and performs the offline translation, in such as way:
def resolve_addr2line(addr2line, module, offset):
    """
    Call addr2line to resolve address to file and line number.
    """
    try:
        result = subprocess.run(
            [addr2line, "-e", module, "-f", "-C", "-p", offset],
            stdout=subprocess.PIPE,
            stderr=subprocess.PIPE,
            text=True,
            check=True)
        return result.stdout.strip()
    except subprocess.CalledProcessError:
        return f"?? () at {module} + {offset}"

def parse_backtrace(machine_, debug_info_):
    """
    Parse backtrace from stdin, resolve addresses, and print in GDB format.
    """
    backtrace = []
    addr_re = re.compile(r"^\s*\|_\s+(\S+)\s+\+\s+(0x[0-9a-fA-F]+)")
    frame_number = 0

    for line in sys.stdin:
        match = addr_re.match(line)
        if match:
            module, offset = match.groups()
            abs_module = os.path.join(debug_info_, module.lstrip("/"))
            resolved = resolve_addr2line(addr2line, abs_module, offset)
            backtrace.append(f"#{frame_number}  {resolved}")
            frame_number += 1

    print("\nResolved backtrace:")
    print("\n".join(backtrace))
That’s it about the generic concepts around how to get backtraces.
A specific use-case: DWARF-based backtraces on ARMv7
In the first part of this article, I tried to keep the context somehow generic, so that you can use the knowledge to have libunwind based backtraces on your specific hardware. In this second part, we will mostly address the pitfalls that I experienced while trying to get backtraces for a C++ firmware on an ARMv7 target.
ARM Exception Index tables limitations
Initially, I chose to rely on ARM EXIDX tables, which seems sensible because those sections are already part of the stripped binaries that are produced by Yocto. I then discovered that in the case of printing backtrace on unhandled C++ exception, I had incomplete backtraces:
On ARMv7:
Unexpected exception caught!
Backtrace:
  0x148b8: unexpected_handler() + 0x20
  0x2ddac: __cxxabiv1::__terminate(void (*)()) + 0x8
  0x12aa4: std::terminate() + 0xc
On x86_64:
Unexpected exception caught!
Backtrace:
  0x401465: unexpected_handler() + 0x18
  0x7f16440b0e6a: std::rethrow_exception(std::__exception_ptr::exception_ptr) + 0x7a
  0x7f16440b0ed5: std::terminate() + 0x15
  0x7f16440b1128: __cxa_throw + 0x48
  0x4014df: uncaught_function() + 0x27
  0x4014f2: main + 0x13
  0x7f1643e4bbf7: __libc_start_call_main + 0x67
  0x7f1643e4bcac: __libc_start_main + 0x7c
  0x4011b1: _start + 0x21
On aarch64:
Unexpected exception caught!
Backtrace:
  0x4000001f48: unexpected_handler() + 0x24
  0x4001972010: <unknown>
  0x4001972094: std::terminate() + 0x14
  0x40019723e4: __cxa_throw + 0x64
  0x4000001fdc: uncaught_function() + 0x30
  0x4000001ff8: main + 0x1c
  0x4001bfb230: <unknown>
  0x4001bfb30c: __libc_start_main + 0x9c
I reported that one to the GCC bugtracker. It seems that this is a known limitation of the ARM EXIDX, that could one day be addressed.
I then chose to rely on DWARF unwinding tables, and more specifically the
.debug_frame section that is present on ARMv7 binaries compiled with GCC but
stripped by default. To work around that, I made a patch to Yocto so that one
can ask for specific ELF sections not be stripped in the Yocto configuration:
PACKAGE_KEEP_SECTIONS = ".debug_frame"
I submitted that one to Yocto but with little success. That’s an intricate topic, and I guess my explanations on the mailing list were not clear enough to have that one merged. Maybe I will try again and refer to that article.
Yet, the key concept to understand here is that to have your binary compiled
with frame pointers or with a .debug_frame section is not enough. If you
want complete backtraces no matter what, you then need all the libraries that
are used by your program, and recursively their dependencies, to embed the
same kind of unwinding material.
That is why, it is needed to have an option at the Yocto level that guarantees
that everything that is compiled and stripped by Yocto keeps a .debug_frame
section. Without that, the backtrace will end at the first glibc call.
When targeting something else than an embedded device where you fully generate
the image with Yocto, a server that runs a Debian image for instance, things
are different. If the libraries are managed with apt and they do not contain
the right unwind tables then you have less margin. You can generate a big
statically linked library, or manage to deploy your application bundled with
the required shared libraries. Of course they will be compiled with unwinding
tables and symbols.
Broken ARM support in libunwind
Out of the box, libunwind tries to rely on ARM EXIDX for unwinding. Because we
want to use DWARF, .debug_frame based unwinding, we then need to configure
libunwind in such a way. It can be done using the UNW_ARM_UNWIND_METHOD
environment variable to 1 which means UNW_ARM_METHOD_DWARF.
That variable can also be set to:
#define UNW_ARM_METHOD_ALL          0xFF
#define UNW_ARM_METHOD_DWARF        0x01
#define UNW_ARM_METHOD_FRAME        0x02
#define UNW_ARM_METHOD_EXIDX        0x04
#define UNW_ARM_METHOD_LR           0x08
The next issue was that on master, support for DWARF based unwinding on ARM was completely broken. I bisected the source of the issue to that commit. I managed to have that commit reverted and added a specific test case for DWARF based unwinding on ARM.
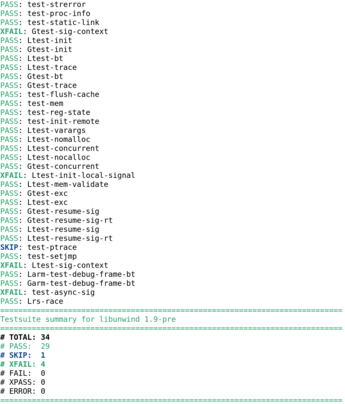
Afterwards, some of the libunwind tests on ARM were still failing. That’s unfortunate because when new pull requests are made for libunwind people often only care about the overall status of the architecture. If the ARM tests were already failing, they won’t consider the new failing sub test cases for that architecture. With multiple other commits to libunwind I managed to have all the ARM tests passing, which makes it easier to spot new regressions.
Conclusion
The combination of DWARF unwinding tables with minidebuginfo and libunwind provides a somehow portable way of getting backtraces for your embedded C and C++ programs with an acceptable overhead. For people on ARM with drastic storage concerns, then one can also rely on ARM EXIDX and possibly offline translation to get backtraces with almost no overhead.
Setting up and maintaining such an infrastructure has a cost, because it requires developers which are familiar with low level programming on their architecture as well as a minimal knowledge of libunwind and the basics behind backtracing. Nonetheless, I think that deploying libunwind on the field in addition to coredump based debugging during development makes a lot of sense.
Being able to read the backtrace directly from the syslog of the devices on the field rather than trying to reproduce the issue locally is really a game changer when you are deploying huge fleet of devices with C and C++ firmware.