Debugging an embedded Linux system - part II
Let’s say you are building drones based on an embedded Linux system. You only have a single CPU running Linux and no redundancy. Your are running the excellent Ardupilot as a flight stack, user-space process. Bad luck, Ardupilot crashes. It can be restarted by systemd and the backtrace can be save somewhere as we will see in the third part. Your drone can potentially recover from that while flying.
Now what if the Linux kernel crashes, because of a race condition in the iio IMU driver? Well, everything will get completely stuck, your hardware watchdog will kick-in, reset your device, that will boot again, and restart your flight stack. The problem is that it will take a while. By the time the flight stack is running again, there are good chances that your drone will be shattered on the ground.
If the hardware is still in one piece, you can try to retrieve the file that contains your system logs, see the part I for the importance of logging. Depending on how your system is configured, and the exact nature of the crash, there’s a chance that the Linux kernel OOPS will be in your system logs. It can also be that the kernel crash was so bad that the OOPS did not make its way to your persistent storage. In that case, you will be left a suddenly stopping system log file without any other indication.
If your product is already commercialized, then to the mystery of drones falling from the sky, will add the pressure of your management for a quick fix.
In that specific case, and for most embedded Linux products, setting up a kdump infrastructure can be of tremendous help to avoid such cases, or at least to have a chance for a quick resolution. Setting up kdump is not as simple as echoing something in the sysfs. Like for the coredump infrastructure of the part I, it needs some configuration and some tooling to be usable.
The game is worth the candle and by setting up kdump correctly, you can obtain a nice backtrace in GDB like that one:
Thread 1 received signal SIGSEGV, Segmentation fault.
rb_add_cached (less=<optimized out>, tree=0xef7d3014, node=0xef7d3320) at ./include/linux/rbtree.h:177
177             link = &parent->rb_right;
(gdb) bt 15
#0  rb_add_cached (less=<optimized out>, tree=0xef7d3014, node=0xef7d3320) at ./include/linux/rbtree.h:177
#1  timerqueue_add (head=0xef7d3014, head@entry=0x1, node=node@entry=0xef7d3320) at lib/timerqueue.c:40
#2  0xc0189570 in enqueue_hrtimer (mode=HRTIMER_MODE_ABS, base=<optimized out>, timer=0xef7d3320) at kernel/time/hrtimer.c:1091
#3  __run_hrtimer (now=<synthetic pointer>, flags=<optimized out>, timer=0xef7d3320, base=0xef7d3000, cpu_base=<optimized out>) at kernel/time/hrtimer.c:1702
#4  __hrtimer_run_queues (cpu_base=cpu_base@entry=0xef7d2fc0, now=<optimized out>, flags=flags@entry=536936851, active_mask=active_mask@entry=15)
    at kernel/time/hrtimer.c:1749
#5  0xc0189d78 in hrtimer_interrupt (dev=<optimized out>) at kernel/time/hrtimer.c:1811
#6  0xc010d454 in twd_handler (irq=<optimized out>, dev_id=<optimized out>) at arch/arm/kernel/smp_twd.c:185
#7  0xc016dd94 in handle_percpu_devid_irq (desc=0xc1018600) at kernel/irq/chip.c:930
#8  0xc01685d0 in generic_handle_irq_desc (desc=<optimized out>) at ./include/linux/irqdesc.h:158
#9  handle_irq_desc (desc=<optimized out>) at kernel/irq/irqdesc.c:646
#10 generic_handle_domain_irq (domain=<optimized out>, hwirq=<optimized out>) at kernel/irq/irqdesc.c:702
#11 0xc0401f10 in gic_handle_irq (regs=<optimized out>) at drivers/irqchip/irq-gic.c:372
#12 0xc08c87e8 in generic_handle_arch_irq (regs=0xc0e01ec8) at kernel/irq/handle.c:242
#13 0xc0100ba8 in __irq_svc () at arch/arm/kernel/entry-armv.S:221
#14 0xc0100ba8 in __irq_svc () at arch/arm/kernel/entry-armv.S:221
(More stack frames follow...)
(taken from https://unix.stackexchange.com/questions/785149/kernel-oops-gdb-backtrace-debug-help)
There in GDB you can do the usual stuff, see the threads, their backtraces, the content of the stack and the registers between other things. That will be post-mortem, so no stepping, but as discussed in the part I, that’s best avoided anyways.
What’s that kdump thing?
To shamelessly quote Wikipedia, kdump is a feature of the Linux kernel that creates crash dumps in the event of a kernel crash. When triggered, kdump exports a memory image (also known as vmcore) that can be analyzed for the purposes of debugging and determining the cause of a crash.
Let’s break down the different steps involved, from configuring kdump to the final crash analysis on the vmcore file.
Kernel configuration
Kdump is based on having your living dead kernel starting another kernel with the kexec mechanism. Kexec is a Linux kernel feature that allows loading a new kernel into memory and booting it without going through the bootloader.
The newly spawned kernel will only have a single role: collect the crash dump (kernel dump) of your first kernel, store it somewhere safe and most likely reboot into a normal system.
Let’s refer to the first kernel as the normal kernel and to that second kernel as the kdump kernel. The kdump kernel needs to collect the kernel dump from the memory, but it will itself needs some memory to operate.
To make sure that the kdump kernel does not overwrite some memory of the first kernel that we want to dump, the trick is to restrict a portion of the memory in the first kernel, and to use that portion for the kdump kernel. That will be a memory sacrifice as unless your kernel is completely unstable you will rarely boot the kdump kernel, however, the portion will always be reserved in the normal kernel, no matter what.
The good thing is that if your kdump kernel is not too big, you really don’t need much memory, 32 MiB could be OK for instance. At that point you have probably understood that we need two kernels:
-
The normal kernel that you already have, but configured to support kexec, and to reserve some memory for the kdump kernel.
-
The kdump kernel, that can be quite minimalist. It only needs kdump support to dump the memory of the first kernel, and the drivers required to store the kdump somewhere.
Here, I am often relying on a small hack. As my normal kernel is already quite minimal because we are dealing with embedded Linux, I do not make any difference between by normal kernel and my kdump kernel. Those are the same kernels. Besides avoiding the cost of maintaining two different kernel configurations, that hack is also convenient because Yocto is painfully bad at dealing with several Linux kernels recipes.
To extend my kernel configuration to add kdump support, I will add the following Kconfig options:
CONFIG_KEXEC=y
CONFIG_CRASH_DUMP=y
CONFIG_PROC_VMCORE=y
CONFIG_DEBUG_INFO=y
CONFIG_GDB_SCRIPTS=y
The first option will be needed by the normal kernel to kexec the kdump
kernel. The second option will be needed by the kdump kernel to generate the
memory dump. The third option is also needed by the kdump kernel to make the
kernel dump available in the /proc/vmcore file. The fourth option is
required so that a vmlinux file with all the debugging symbols in also
generated. That vmlinux file will be used later on when we will analyze the
kdump with GDB. The fifth option is required so that the Python GDB scripts
that are needed to analyze a kdump in GDB are compiled. As we have a unique
kernel, the five options go to the same Kconfig.
OK, we now have our normal kernel that can be used in two different contexts, as a normal kernel and as a kdump kernel. What about the memory reservation for the kdump kernel?
Setting up the normal kernel cmdline
It can be done using the command line of the normal kernel:
crashkernel=32M@0x24000000
There we instruct the normal kernel to reserve 32 MiB at the address 0x24000000 for the kdump kernel. The advantage of doing that over the command line, is that you can control from the bootloader if you want to enable the kdump mechanism or not.
The device-tree of the kdump kernel
There are good chances that you have a device-tree for your normal kernel. That device-tree will describe the memory map of your system. The problem here is that the kdump kernel won’t have the same memory map. The kdump kernel can only see its restricted portion of the memory.
To do that, we can create a new device-tree for the kdump kernel. That device-tree can look like:
/dts-v1/;
#include "normal-device-tree.dts"

/ {
    memory@24000000 {
            device_type = "memory";
            reg = <0x24000000 0x1000000>;
    };

   /delete-node/memory@20000000;
};
To make things easy from the maintenance point of view, we are also inheriting from the normal kernel device-tree and only modifying the memory map.
Preparing the kdump initramfs
When the kdump kernel is started, it needs to collect the /proc/vmcore file
and to store it somewhere. To do that, I use an initramfs dedicated to that
purpose. Having multiple initramfs and device-trees is easy from the Yocto
perspective, so let’s take advantage of that.
We can define an initramfs-kdump_1.0.bb recipe:
SUMMARY = "Kdump initramfs"
LICENSE = "CLOSED"
SRC_URI = "file://init-kdump.sh "
FILESEXTRAPATHS:prepend := "${THISDIR}/files:"

S = "${WORKDIR}"

do_install() {
        install -m 0755 ${WORKDIR}/init-kdump.sh ${D}/init
}

inherit allarch

FILES:${PN} += " /init "
The initramfs will only consist of the init-kdump.sh script:
#!/bin/sh

echo ""
echo "Kdump initramfs"

PATH=/sbin:/bin:/usr/sbin:/usr/bin

# procfs / sysfs
if [ ! -d /proc ] ; then
	mkdir /proc
fi
if [ ! -d /sys ] ; then
	mkdir /sys
fi

mount -t proc proc /proc
mount -t sysfs sysfs /sys

kdump_part=/dev/mmcblk0p11
kdump_dir=/opt/kdump
vmcore=vmcore_$(date +%s)

fsck.ext4 -y ${kdump_part}
mkdir -p ${kdump_dir}
mount ${kdump_part} ${kdump_dir}

cp /proc/vmcore ${kdump_dir}/${vmcore}
sync

echo "${vmcore} saved"
umount ${kdump_dir}
echo "${kdump_dir} umounted"

sleep infinity
Here we are performing the following tasks:
- We create an ext4 partition at
/dev/mmcblk0p11 - We mount that partition in
/opt/kdump - We copy the
/proc/vmcorefile to/opt/kdump - We clean-up and wait for something else to restart the device
We also need a dedicated Yocto initramfs image recipe, than embeds the
previously defined initramfs-kdump recipe:
DESCRIPTION = "Kdump initramfs"
LICENSE = "CLOSED"

PACKAGE_INSTALL = "initramfs-kdump busybox e2fsprogs-e2fsck"

# Do not pollute the initrd image with rootfs features
IMAGE_FEATURES = ""

export IMAGE_BASENAME = "initramfs-image-kdump"
IMAGE_LINGUAS = ""

IMAGE_FSTYPES = "${INITRAMFS_FSTYPES}"

inherit core-image
We then need to configure Yocto to build the kdump device-tree and initramfs and to place them inside the normal image. To do that you can add the following snippet to your normal Yocto image recipe:
KDUMP_INITRAMFS="initramfs-image-kdump"

do_rootfs[depends] += "${KDUMP_INITRAMFS}:do_image_complete"

install_dtb_symlink() {
    ln -sf kdump.dtb ${IMAGE_ROOTFS}/boot/kdump.dtb
}

install_initramfs() {
    cp ${DEPLOY_DIR_IMAGE}/${KDUMP_INITRAMFS}-${MACHINE}.cpio.gz ${IMAGE_ROOTFS}/boot/
    ln -sf ${KDUMP_INITRAMFS}-${MACHINE}.cpio.gz ${IMAGE_ROOTFS}/boot/initramfs.gz
}

IMAGE_PREPROCESS_COMMAND:append = "install_initramfs; install_dtb_symlink; "
Kexec-ing the kdump kernel
We have our kernel configured, the kdump device-tree and initramfs, and the normal kernel performing the memory reservation for the kdump kernel. It’s time to use the kexec mechanism to setup the kdump kernel for execution upon the panic of the normal kernel.
That needs to be done at runtime, with a command similar to:
kexec -p /boot/zImage --initrd=/boot/kdump-initramfs.cpio.gz --dtb=/boot/kdump.dtb --append="console=ttyS0,115200"
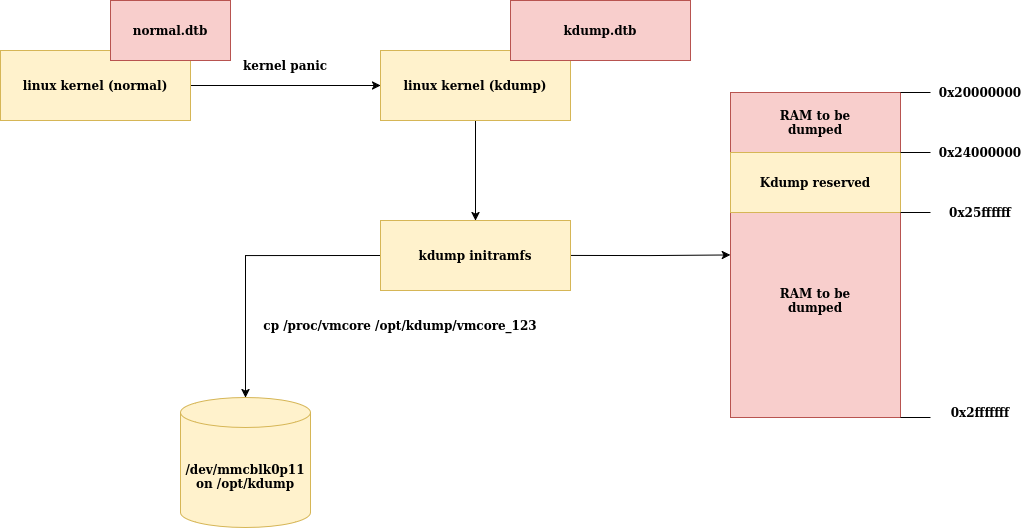
Time to take a step back. Here is an overview of what will happen if we have a
kernel panic during the execution of the normal kernel. The kdump kernel,
which is the same as the normal kernel, will start from the reserved location
at 0x24000000. It will start the kdump initramfs, which will copy the
/proc/vmcore file to a dedicated location in the persistent storage.
Analyze the vmcore
In our specific example, the vmcore file will now live in the /dev/mmcblk0p11
partition. That one can be mounted in the normal system and the vmcore can be
fetched from there. It would have been possible to directly send the
/proc/vmcore to the cloud from the kdump initramfs, or anything else.
Regardless of the option that you choose, getting that file was the first step. The second step is to make use of it. To analyze the vmcore file, we will need:
-
The
vmlinuxfile which is the kernel with all the debug symbols inside. It will be way heavier that thezImagekernel that is compressed and stripped, as it is embedded on the target. -
The Python scripts for GDB of the Linux kernel. They are providing convenient GDB macros to extract some stuff from the vmcore file. They allow to print the
dmesgat the time of the crash, the loaded modules and other niceties. Those scripts are documented here: https://docs.kernel.org/dev-tools/gdb-kernel-debugging.htmlYou will need to run
make scripts_gdbfrom your Linux recipe to compile those scripts. Note that they are only available from the Linux kernel5.1and above.
do_compile:prepend() {
	oe_runmake scripts_gdb
}
- The
/proc/vmcorefile itself obviously. We cannot forget that one after all the stuff what we had to setup in order to fetch it.
In order to have all those elements ready, they need to be saved as build artifacts. In the same spirit as for the coredump archive in the part I, those artifacts need to be stored together with your images on your release server. As there will be a 1-to-1 match between your running kernel and the vmlinux file, you will always need to right vmlinux for the vmcore file that you are analyzing.
Extending the Yocto Linux recipe, is a way to have those elements stored as build artifacts:
do_deploy:append() {
        OUTPUT_GDB_INFO=${DEPLOYDIR}/${MACHINE}-kdump-gdb-info.tar
        tar --dereference  -cf ${OUTPUT_GDB_INFO} vmlinux vmlinux-gdb.py scripts/gdb
}
You are now ready for the final commands:
sudo apt update && sudo apt install gdb-multiarch
echo "set auto-load safe-path /" > ~/.gdbinit
mkdir -p /tmp/kdump && tar -xvf artifacts/my-machine-kdump-gdb-info.tar -C /tmp/kdump
gdb-multiarch /tmp/kdump/vmlinux ~/vmcore_1325376201
There we have GDB, augmented by the Linux kernel Python macros, ready to
analyze the vmcore. The main command will still be the GDB internal
backtrace command, to get the backtrace at the time of the kernel OOPS:
Thread 1 received signal SIGSEGV, Segmentation fault.
rb_add_cached (less=<optimized out>, tree=0xef7d3014, node=0xef7d3320) at ./include/linux/rbtree.h:177
177             link = &parent->rb_right;
(gdb) backtrace
#0  rb_add_cached (less=<optimized out>, tree=0xef7d3014, node=0xef7d3320) at ./include/linux/rbtree.h:177
#1  timerqueue_add (head=0xef7d3014, head@entry=0x1, node=node@entry=0xef7d3320) at lib/timerqueue.c:40
...
but the additional macros such as lx-dmesg, lx-ps, lx-lsmod can also be
quite handy:
(gdb) lx-dmesg
[     0.000000] Initializing cgroup subsys cpuset
[     0.000000] Initializing cgroup subsys cpu
Note that the few commands needed to have GDB running over the /proc/vmcore
file can be automated in a helper script. That can possibly be the same helper
script that was introduced in the first part the have GDB running over a core
dump.
def analyze_kdump(kdump, machine_, debug_dir_):
    """
    Run GDB with the environment setup to analyze the given kdump file.
    """
    # Format the GDB commands to load symbols from the kernel modules.
    gdb_cmds = "-ex 'set confirm off' "

    vmlinux = os.path.join(debug_dir_, "vmlinux_" + machine_.split("-", 1)[0])
    vmlinux_gdb = os.path.join(debug_dir_, "vmlinux-gdb.py")
    gdb_cmds += F"-ex 'source {vmlinux_gdb}' " + F"-ex 'core-file {kdump}' " + "-ex bt"
    subprocess.run("gdb-multiarch " + vmlinux + " " + gdb_cmds,
                   shell=True, check=True)
Debugging out of tree modules
When using an embedded Linux kernel, you will use some of the generic schedulers of the Linux kernel, the file-system drivers and other well tested layers of the kernel. Those layers are shared with the desktop world, and there are good chances that if you are hitting a bug many other parties will have the same issue and it will get fixed promptly.
Then, you will also use some drivers specific to your target. For those drivers, it is not uncommon to be the only person ever using an RTC driver with a specific register set, that has a regression because of some changes in the RTC generic layer. Given the time that I spend updating kernels, I can tell you that having such issues is sadly super frequent.
For those drivers, that are prone to failure, we now have kdump to help us understand the kernel OOPS that can occur. There is also a third category of kernel sources that are even more susceptible to fail: the dreaded out of tree kernel modules.
Those are drivers that were written in a hurry, and poorly maintained over the years by non-Linux kernel developers. They are from experience the cause of most of the kernel failures even if they only account for a very small part of the code base.
The infrastructure, as presented above, cannot deal with those out of tree
drivers because their symbols are not part of the vmlinux file. To have
those drivers taken into account, we need to explain GDB how to get their
symbols.
In the part I, we explained how to get a symbols archive generated by Yocto. If the out of tree drivers are also compiled by Yocto, which is likely, the modules with symbols will be part of the symbols archive.
GDB can be instructed to use those, with the following command:
(gdb) add-symbol-file symbols/package/lib/modules/6.10.2-yocto-standard/updates/my-module.ko 0xbf00e000
The 0xbf00e000 address is the address where the kernel module was loaded by
the kernel. It can be retrieved by running the cat /proc/modules command on
the target:
my-module 20480 3 - Live 0xbf00e000 (O)
This can once again be automated in our helper script, by modifying the
analyze_kdump function above this way:
def analyze_kdump(kdump, machine_, debug_dir_):
    """
    Run GDB with the environment setup to analyze the given kdump file.
    This will connect to the target to get the modules load addresses.
    """
    modules_info = []
    target = "root@10.0.0.1"
    print("Fetching kernel module addresses from the target ...")
    modules = execute(F"ssh {target} cat /proc/modules")

    # Parse the kernel modules names and addresses.
    for line in modules.strip().split('\n'):
        parts = line.split()
        if len(parts) >= 6:
            module_name = parts[0]
            module_address = parts[5]
            modules_info.append((module_name, module_address))

    # Format the GDB commands to load symbols from the kernel modules.
    gdb_cmds = "-ex 'set confirm off' "
    for module_name, module_address in modules_info:
        module_path = find_file(debug_dir_, module_name + ".ko")
        print("  address:", module_address)
        if not module_path:
            print("     no symbols found")
            continue

        gdb_cmds += F"-ex 'add-symbol-file {module_path} {module_address}' "

    vmlinux = os.path.join(debug_dir_, "vmlinux_" + machine_.split("-", 1)[0])
    vmlinux_gdb = os.path.join(debug_dir_, "vmlinux-gdb.py")
    gdb_cmds += F"-ex 'source {vmlinux_gdb}' " + F"-ex 'core-file {kdump}' " + "-ex bt"
    subprocess.run("gdb-multiarch " + vmlinux + " " + gdb_cmds,
                   shell=True, check=True)
By doing so, if the OOPS is caused by any out of tree drivers, then their symbols will be part of the backtrace printed by GDB. If you do not add the out of tree symbols to GDB, but the OOPS is caused by an out of tree driver then the backtrace will just be empty or unusable.
Do I panic?
We have one last point to cover. For the kdump kernel to be started by the kexec mechanism we need the normal Linux kernel to panic. It can be that your normal kernel has a problem but does not panic. For instance, your hardware watchdog driver can be configured to reset the board instead of panic-ing. It can also be that your kernel encounters a warning or a OOPS but does not panic. In that case adding the following elements to your kernel command line, will make the kernel panic in most situations:
panic_on_warn=1 sysctl.kernel.panic_on_oops=1
Those options can be dangerous in production. We might prefer to have a real watchdog reset, rather than going to the kdump kernel, saving the kdump, rebooting, as it takes a lot of time. Maybe you also prefer to have your kernel trying to stay alive no matter what, in case of warnings and OOPS, instead of firing up the kdump kernel at the first sign of issue. But that’s up to you and to your use-case to arbitrate those decisions.
Conclusion
As we saw, setting up a kdump infrastructure is not the simplest thing in the universe. We need to have a kdump kernel with a dedicated device-tree and initramfs that will save the kernel dump. We also need to have a host infrastructure ready to analyze the kdumps with GDB. If there are out of tree kernel modules in the mix then we also have to deal with those in a specific way. I personally think that it is still worth setting up this infrastructure. Having to a way to get backtraces in case of subtle kernel crashes instead of being completely in the dark can help you sleep when dealing with embedded Linux systems on a daily basis.
However, given the effort that it represents, it might be a good decision to set that one up before encountering mysterious kernel issues in production.
In the last article of this series, we will go back to the user-space world and see how we can use libunwind to get nice backtraces, without core dump, when C and C++ programs are crashing on the target.